The goal of this lab is to understand how to georeference data that has no spatial reference information. Then new data can be created and used to solve spatial analysis problems.
Methods:
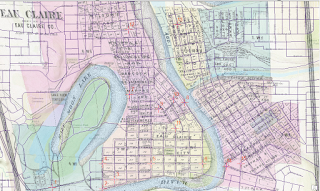
The first step of the lab was to add data that has spatial information attached, and is very accurate. In this case, it is a shapefile of transportation networks and roads of Eau Claire county. Then a basemap is added, and finally the non-georeferenced image was added. This image is shown below in Figure 1 and is from a 1878 historic map of Eau Claire.
 |
| Figure 1. A historic map of Eau Claire that has no spatial information attached. It will be georeferenced to make the map more accurate to modern day. |
Then, using the georeferencing toolbar, control points were added. These control points connect a point on the historic map to a point on the shapefile for the transportation network, georeferencing points on the historic map. In this case, 15 control points were used. Control points where placed on features like street intersections or distinctive areas. Water features were not used as they can change between years. The idea is to have enough control points and have a low RMS error, meaning the true point and ungeoreferenced point are close enough. The map is shown in Figure 2 with control points added.
 |
| Figure 2. Note the red crosses with numbers, these are the control points. This image shows an already transformed raster. |
Part two of the lab features creating data, specifically water features as polygons. A new feature class was created in a file geodatabase. The boundaries of Half Moon Lake, Chippewa River, and the Eau Claire River from the 1878 map were then digitized. An example of the digitized features is shown below in Figure 3.
 |
| Figure 3. Digitized polygons. These are the water features from the 1878 map overlayed on the current features. |
Results:
Sources:
Eau Claire and Medford[Photograph found in David Rumsey Map Collection]. Retrieved from https://www.davidrumsey.com/luna/servlet/detail/RUMSEY~8~1~4181~480085# (Originally photographed 1878)
Eau Claire County. [Master_Centerlines feature class (clipped)]. Raw data.
ESRI. (2018). World Topographic Map [Map].


No comments:
Post a Comment